Search This Blog

Showing posts with label House Prices. Show all posts

Monday, October 13, 2014

Another Sign that the Philippine Real Estate Bubble May Have Already Peaked?

In a technical analysis of the price trends of financial securities, volume is a very important technical indicator. If the volume moves with the trend, the volume confirms the trend. When price and volume diverge, it is often indicative of a shift in the trend. For example, if an uptrending stock price is accompanied by lower and lower volumes, it may indicate that the price trend is weak and that prices may start to decline.


The same holds true for the real estate market.

US Real Estate Market

In the US, sales volumes peaked for US Total Home Sales (New and Existing Home Sales) at 8,4 million homes in 2005, a year before the US Median Sales Price peaked at US$ 225K in 2006.  By 2007, the US Median Sales Price slipped by only 1% to US$ 223K while sales volumes had already dropped an astonishing 30.58% from the peak sales volume in 2005, to 5.8 million in 2007.

From then on, the US Median Sales Prices continued to decline year after year, bottoming out at $170K in 2011, or some 25% below the peak price level.  By then sales volumes had already bottomed out a year earlier in 2010 to 4.5 million homes, or some 46% below peak volumes.


Sources: Realtor.org, St. Louis Fed

Median Sales Price is a weighted average of the median sales prices of New Home Sales and Existing Home Sales


The same dynamic played out in both segments of the US Residential Real Estate Market: New Home Sales and Existing Home Sales.

Here is the chart for New Home Sales:


And here is the chart for Existing Home Sales, the much larger market segment.


Philippine Real Estate Market

Might the same dynamic be playing out in the Philippine residential real estate market?  One problem bedevilling such an analysis is the dearth of data.

To my knowledge, the Philippines does not have adequate market data.  For instance, there seem to be no published figures for sales volumes for residential homes.  The best approximation of such data is HLURB's statistics for licenses to sell residential homes.  This statistic represents only new homes and only represents licenses to sell for each residential unit and not the actual sales volumes.

Another issue is that there seems to be no price data on residential sales.  The best data is assembled here, which in turn, is assembled from the Philippine Office of Colliers International, a global real estate agency.  These prices, in turn, are based on the average prices of a prime 3 bedroom condominium unit in the heart of the Makati Central Business District.  This is like basing nationwide US housing prices on the price of a prime 3 bedroom coop unit in Manhattan in New York, one of the priciest real estate markets in the US.  The data available in the Philippines is not representative of the true state of the entire national residential real estate market.  At best, it is an approximation of the Philippine Real Estate Market.  The BSP has stepped into the picture to overcome this deficiency by developing their own real estate index, which would be more comprehensive in scope. Here is a possible candidate for such an index.

But based on the data available, we arrived at this chart:


Based on this data, volumes (as indicated by Residential HLURB licenses to sell) may have already peaked in 2012, while prices have continued their upward climb to date.  Volume seems to have peaked at 264,237 units in 2012 and dropped 15% to 225,051 units in 2013.  In the first quarter of 2014, volumes declined further on an annualized basis, to just 189,668 units or 28% below peak volumes. 

Prices though, have continued to climb since 2012, another 14% in 2013 and another 2% in the first quarter of 2014, representing a 16% increase over 2012 prices.

Is the same dynamic that played out in the US Residential Real Estate Market playing out in the Philippines?  It looks like it, but it may still be too early to tell.

Monday, July 21, 2014

Singapore, Malaysia, and Thailand Post Flat to Declining Housing Prices, Can the Philippines and Indonesia be Not Far Behind?

Singapore


Singapore's home prices slid for a third straight quarter, which, according to Bloomberg, is the longest losing streak in five years.  Home prices are still  86% above their year end 2004 levels. As can be seen from the chart below, Singapore's home prices have outstripped inflation by a wide margin.


Malaysia

Neighboring Malaysia's House Price Index actually topped out at 141.25% in the second quarter of 2012 and has posted a 3.37% decline since then to 136.48% as of the fourth quarter of 2013.  Home prices are just 36.48% above their year end 2004 levels.  Malaysian home prices tracked inflation for some time between 2004 and late 2009.  However, beginning in 2010, house prices outstripped inflation and have never looked back.


Thailand


In Thailand, which has been experiencing political turmoil for some time, home prices have remained essentially flat since the end of 2004. Home Prices ended 2013 with the index at 100.54%, just 054% higher than the end of 2004, but showing a substantial recovery since the recent low of 74.08% posted in the third quarter of 2009. Thailand, along with Indonesia, is one of the few ASEAN countries whose home prices have significantly lagged inflation, particularly since mid 2006.


Indonesia

Meanwhile in Indonesia, home prices have showed no signs of slowing down their upward trajectory.  In fact, prices seem to have gone parabolic, climbing 4.63% in the last quarter of 2013, from a base of 121.49% as of the third quarter of 2013 to 127.11% as of year end 2013.  Since 2006, home prices have risen 36.48%.  Indonesian home prices, like in Thailand, have lagged inflation since 2007.


Philippines

Philippine house price index stands at 196.65% at year end 2013, 96.65% above their year-end 2004 levels and have consistently outstripped inflation by a wide margin. Philippine home prices have posted the largest 10 year gains among all the countries considered in this blog post.  Like Indonesia, home prices have so far no signs of slowing down their upward trajectory for the foreseeable future.   The question is, is this momentum sustainable?  Or will the Philippines and Indonesia follow its ASEAN neighbors, Singapore, Malaysia, and Thailand, in exhibiting plateauing or declining house prices?  That remains to be seen.


Friday, May 10, 2013

If There is a Real Estate Bubble in the Philippines, How Quickly Can It Burst?

Editor's Note: This is an update of four previous blog posts:"Is There a Real Estate Bubble in the Philippines? - June 2012", 
 "Is There a Real Estate Bubble in the Philippines - Part II", "The Philippine Banking System's True Exposure to Real Estate", and "Is There a Real Estate Bubble in the Philippines?"

If there is a Real Estate Bubble in the Philippines, how quickly can it burst?  The answer is: very quickly.  Right now, NPLs (non-performing loans) are at a record low of just 2.00% of total loans, levels not seen since 1996, a year prior to the the Asian Financial Crisis.  When the Asian Financial Crisis hit in the Philippines in 1997, NPLs jumped by more than two thirds, to 4.68% of total loans.  The year after that, in 1998, NPLs doubled again to 10.37%.  In the succeeding years, NPLs kept on climbing until it peaked at 17.35% of total loans in 2001.  From then on, it took ten years for NPLs, until 2011, for NPLs to reach the pre-crisis low of 2.80% that was posted in 1996.

NPLs


Loan Growth

One factor that may have lead to the bursting of the bubble was that the growth of loans prior to the Asian Financial Crisis far outpaced the growth in the underlying economy. From 1987 to 1992, loans as a percentage of GDP climbed slowly, from a moribund 18.4% of GDP in 1987 to 24.5% of GDP in 1992.  From 1992 onwards, loans as a percentage of GDP grew relentlessly each year.  Just five years later, this ratio stood at 58.5% of GDP, more than double the 24.5% ratio posted five years earlier in 1992.

The sharp climb in loan growth from 1992 to 1997 indicates a significant loosening of loan underwriting standards.  Loans grew at a pace faster than the economy could handle.  Bankers lent and borrowers borrowed more money than they ever knew what to do with.

The question is, are we in that same situation again?  The data indicates otherwise.  For the past five years, loans as percentage of GDP have been stuck in the low 30s.  It currently stands at 32.7% as of October 2012.


House Prices  

During the last US housing bubble, loan defaults remained low because borrowers who couldn't repay their mortgages simply sold the house, the underlying collateral, into an ever rising real estate market.  When housing prices plateaued or declined, NPLs began to climb very sharply.


The same was true for housing busts in other countries such as Spain...


and Greece...


and Ireland.


Now, is the same true for the Philippines?  Have house prices peaked?

Based on the latest available data, not yet.


Investment Overhang

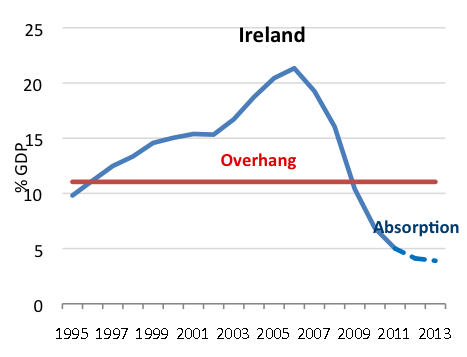
In all these markets, the busts were due to an over investment in residential assets that was way, way above the historical average.

In the US, Residential Fixed Investment as a % of GDP strayed way above the historical average of 4.20% of GDP, peaking at 6.20% of GDP in 2005.


As this graph suggests, the cumulative overhang still needs to be worked off the system, as it did during the Great Depression.


The same goes true for Spain


and Ireland.


Might this be true of the Philippines as well?

Based on the available data, which covers Construction Investment and not Residential Fixed Investment, Construction as a % of GDP averaged 9.35% of GDP from 1990 to 2012.  There was a brief overhang in the years running up to the Asian Financial Crisis and an intermittent overhang from 2009 onwards.


On a cumulative basis, the current construction boom is making up for the under investment that occurred from 2000 to 2009, so the cumulative underhang stills stands at -2.40% of GDP.  At the current rate of growth, equilibrium with historical averages should occur by 2014.  As to whether the Construction Investment will continue to outpace the economy beyond that remains to be seen.


So is the bubble set to burst?  The answer is: not yet, at least on a national scale.  But on a regional scale, such as in Metro Manila, it may just be so.  But that is another story altogether.