Search This Blog

Showing posts with label Construction Investment. Show all posts

Monday, March 20, 2017

Have Real Estate and Construction Loans Reached a Permanently High Plateau in December 2016?

Have Real Estate and Construction Loans as a percentage of the Total Loan Portfolio (TLP) in the Philippine Banking System reached a permanently high plateau?


It would appear so.  Sometime in 2011, these loans have rocketed past their historical range of 12.6% to 16.6% of TLP and have stayed there ever since.  As of December 2016, these loans have shown no sign of coming back down to their historical ranges.  Although that ratio peaked at 20.55% as of September 2013, the ratio remains substantially elevated at 19.83% as of December 2016.

Investment in Construction as a percentage of GDP also remains elevated and, in fact, is at an all time high. This ratio logged 12.22% as of 2016, the highest it has been in twenty-six years.


Philippine Real Estate and Construction Loans Are Out of Whack As of December 2015!

Philippine Real Estate and Construction Loans Are Even More Out of Whack As of September 2015!


Has the Philippine Real Estate Bubble Already Burst?

Is There a Real Estate Bubble in the Philippines?


Are Philippine Real Estate Loans Out of Whack?

Monday, April 4, 2016

Philippine Real Estate and Construction Loans Are Out of Whack As of December 2015!

It sure looks that way, judging from this chart:


It looks like Real Estate and Construction Loans as a percentage of Total Loan Portfolio (TLP) rocketed past its historical range of 12.6% to 16.6% of TLP sometime in 2011.  That ratio peaked at 20.55% as of September 2013 but has bottomed out at 18.61% of TLP as of December 2014. In 2015, this ratio has climbed back up to 19.59% as of December 2015.


Now, are we up to the levels of the previous real estate boom? (as in mid 1990s to 1997?) Honestly, we don't know.  BSP data only goes as far back as 1999 when the previous real estate bubble had already burst and the financial system was most likely deleveraging as evidenced in this chart.


Philippine Real Estate and Construction Loans Are Even More Out of Whack As of September 2015!


Has the Philippine Real Estate Bubble Already Burst?

Is There a Real Estate Bubble in the Philippines?


Are Philippine Real Estate Loans Out of Whack?


Thursday, April 2, 2015

Construction Gross Value Added as a Percentage of GDP Has Now Surpassed Its Asian Financial Crisis Peak!

Last September 29, 2014, we noted that Construction Gross Value Added (Construction GVA) at 11.20% as of the 1st Semester of 2014 was already well above its historical average of 9.48% of GDP since 1990.  This ratio has run at an above average rate since 2009 and has already eaten away at the "cumulative underhang" or underinvestment in construction that has taken place since 2004, when the excessive investment in construction that took place in the mid to late 1990's was being absorbed.


As of year-end 2014, Construction GVA as a percentage of GDP now stands slightly higher at 11.21% of GDP.  But the real story is that Cumulative Construction GVA has gone well above equilibrium and now stands at 1.2% above equilibrium, a rise of 0.8% in just nine months.  Given all the planned new projects that are already at the execution stage, the momentum in Construction Investment will continue.


Monday, September 29, 2014

Is the Philippine Real Estate Bubble About to Burst?

In a previous blog post, we noted that Philippine House Prices have outpaced inflation by a wide margin.


Real Estate as a Store of Value:

In the Philippines, as is true in many other countries, real estate is often seen as a store of value, as a hedge against the relatively high inflation that characterizes so many emerging markets.  The investment options available and trustworthy to the general public tend to be few: government securities such as Treasury Bills, Bank Deposits, etc. As recently as 2012, less than 1% of the population own stocks because it is seen as too complex, or as investment vehicle only for the affluent, or a form of gambling. So to many Filipinos, the equity market is no place to be.

Negative Real Interest Rates

Unfortunately, the safest form of investing open to the general public, Philippine government securities, has been a money loser, inflation-wise, for the past several years.  Philippine Treasury Bill Yield Rates have continued their steady long-term decline to a point that they have barely hovered above zero in 2013.


Although yield rates have climbed in 2014, they do not compensate for the inflation underlying the economy.  As a result, real interest rates have been negative for almost four years running: from 2011 onwards.  Despite the recent rise in yields, real interest rates have dropped even further to a -2.68% as of July 2014.


The prolonged presence of negative real intest rates have increased the impetus to invest in real estate.  Construction as a percentage of GDP is the highest it has ever been since 1997 (the year the Asian Financial Crisis hit the Philippines).  Back in 1997, construction as a % of GDP was 11.14%.  As of the first semester of 2014, this ratio now stands at 11.20%, well above the historic average of 9.48%.


Construction Overhang

As a result, construction as a ratio of GDP has been well above this historic average of 9.48% since 2009.  The gains in construction spending have eaten away at the cumulative underhang or underinvestment in construction that has taken place since 2004, wherein the excessive spending that took place in the late 1990s was being absorbed.  As of now, in the first semester of 2014, the cumulative investment in construction of 0.4% is now at or slightly above equilibrium. But given the momentum of investment, construction investment is likely to surpass equilibrium in the coming years.


Real Estate Loans

The push into real estate is also reflected in Real Estate and Construction Loans.  Beginning sometime in 2010, Real Estate and Construction Loans as a % of Total Loan Portfolio broke out of its historic range of 12.5% to 17.0% from 1999 to 2010.  The percentage share of such loans peaked at 20.52% in September 2013 and has since dropped to just 18.65% as of June 2014.  Although the drop is significant, this ratio still has to drop even further to just reach the top end of its historic range.


Residential Real Estate and Commercial Real Estate Loans as a % of GDP have also begun to level off after climbing sharply since 2010.  Residential Real Estate Loans and Commercial Real Estate Loans now stand at 4.37% and 2.67% of GDP, respectively, as of March 2014.


As it stands, investment in construction and real estate have seem to reach equilibrium.  But the continued and prolonged presence of negative real interest rates will continue to drive investors to seek real estate as a store of value, a safe haven to protect their money against the vagaries of inflation.  The recent jump in Treasury Bill rates may dampen this enthusiasm for real estate but rates have to climb further for such market euphoria to disappear.

Friday, May 10, 2013

If There is a Real Estate Bubble in the Philippines, How Quickly Can It Burst?

Editor's Note: This is an update of four previous blog posts:"Is There a Real Estate Bubble in the Philippines? - June 2012"
 "Is There a Real Estate Bubble in the Philippines - Part II""The Philippine Banking System's True Exposure to Real Estate", and "Is There a Real Estate Bubble in the Philippines?"

If there is a Real Estate Bubble in the Philippines, how quickly can it burst?  The answer is: very quickly.  Right now, NPLs (non-performing loans) are at a record low of just 2.00% of total loans, levels not seen since 1996, a year prior to the the Asian Financial Crisis.  When the Asian Financial Crisis hit in the Philippines in 1997, NPLs jumped by more than two thirds, to 4.68% of total loans.  The year after that, in 1998, NPLs doubled again to 10.37%.  In the succeeding years, NPLs kept on climbing until it peaked at 17.35% of total loans in 2001.  From then on, it took ten years for NPLs, until 2011, for NPLs to reach the pre-crisis low of 2.80% that was posted in 1996.

NPLs


Loan Growth

One factor that may have lead to the bursting of the bubble was that the growth of loans prior to the Asian Financial Crisis far outpaced the growth in the underlying economy. From 1987 to 1992, loans as a percentage of GDP climbed slowly, from a moribund 18.4% of GDP in 1987 to 24.5% of GDP in 1992.  From 1992 onwards, loans as a percentage of GDP grew relentlessly each year.  Just five years later, this ratio stood at 58.5% of GDP, more than double the 24.5% ratio posted five years earlier in 1992.

The sharp climb in loan growth from 1992 to 1997 indicates a significant loosening of loan underwriting standards.  Loans grew at a pace faster than the economy could handle.  Bankers lent and borrowers borrowed more money than they ever knew what to do with.

The question is, are we in that same situation again?  The data indicates otherwise.  For the past five years, loans as percentage of GDP have been stuck in the low 30s.  It currently stands at 32.7% as of October 2012.


House Prices  

During the last US housing bubble, loan defaults remained low because borrowers who couldn't repay their mortgages simply sold the house, the underlying collateral, into an ever rising real estate market.  When housing prices plateaued or declined, NPLs began to climb very sharply.


The same was true for housing busts in other countries such as Spain...


and Greece...


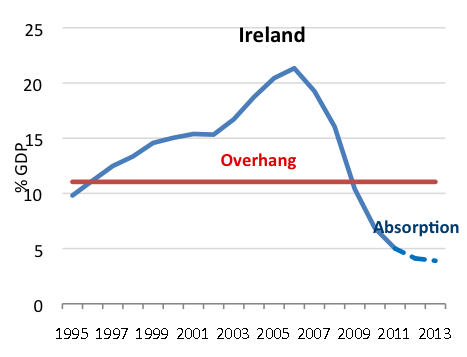
and Ireland.


Now, is the same true for the Philippines?  Have house prices peaked?

Based on the latest available data, not yet.


Investment Overhang

In all these markets, the busts were due to an over investment in residential assets that was way, way above the historical average.

In the US, Residential Fixed Investment as a % of GDP strayed way above the historical average of 4.20% of GDP, peaking at 6.20% of GDP in 2005.


As this graph suggests, the cumulative overhang still needs to be worked off the system, as it did during the Great Depression.


The same goes true for Spain


and Ireland.


Might this be true of the Philippines as well?

Based on the available data, which covers Construction Investment and not Residential Fixed Investment, Construction as a % of GDP averaged 9.35% of GDP from 1990 to 2012.  There was a brief overhang in the years running up to the Asian Financial Crisis and an intermittent overhang from 2009 onwards.


On a cumulative basis, the current construction boom is making up for the under investment that occurred from 2000 to 2009, so the cumulative underhang stills stands at -2.40% of GDP.  At the current rate of growth, equilibrium with historical averages should occur by 2014.  As to whether the Construction Investment will continue to outpace the economy beyond that remains to be seen.


So is the bubble set to burst?  The answer is: not yet, at least on a national scale.  But on a regional scale, such as in Metro Manila, it may just be so.  But that is another story altogether.