Search This Blog

Showing posts with label ROPOA. Show all posts

Friday, May 10, 2013

If There is a Real Estate Bubble in the Philippines, How Quickly Can It Burst?

Editor's Note: This is an update of four previous blog posts:"Is There a Real Estate Bubble in the Philippines? - June 2012"
 "Is There a Real Estate Bubble in the Philippines - Part II""The Philippine Banking System's True Exposure to Real Estate", and "Is There a Real Estate Bubble in the Philippines?"

If there is a Real Estate Bubble in the Philippines, how quickly can it burst?  The answer is: very quickly.  Right now, NPLs (non-performing loans) are at a record low of just 2.00% of total loans, levels not seen since 1996, a year prior to the the Asian Financial Crisis.  When the Asian Financial Crisis hit in the Philippines in 1997, NPLs jumped by more than two thirds, to 4.68% of total loans.  The year after that, in 1998, NPLs doubled again to 10.37%.  In the succeeding years, NPLs kept on climbing until it peaked at 17.35% of total loans in 2001.  From then on, it took ten years for NPLs, until 2011, for NPLs to reach the pre-crisis low of 2.80% that was posted in 1996.

NPLs


Loan Growth

One factor that may have lead to the bursting of the bubble was that the growth of loans prior to the Asian Financial Crisis far outpaced the growth in the underlying economy. From 1987 to 1992, loans as a percentage of GDP climbed slowly, from a moribund 18.4% of GDP in 1987 to 24.5% of GDP in 1992.  From 1992 onwards, loans as a percentage of GDP grew relentlessly each year.  Just five years later, this ratio stood at 58.5% of GDP, more than double the 24.5% ratio posted five years earlier in 1992.

The sharp climb in loan growth from 1992 to 1997 indicates a significant loosening of loan underwriting standards.  Loans grew at a pace faster than the economy could handle.  Bankers lent and borrowers borrowed more money than they ever knew what to do with.

The question is, are we in that same situation again?  The data indicates otherwise.  For the past five years, loans as percentage of GDP have been stuck in the low 30s.  It currently stands at 32.7% as of October 2012.


House Prices  

During the last US housing bubble, loan defaults remained low because borrowers who couldn't repay their mortgages simply sold the house, the underlying collateral, into an ever rising real estate market.  When housing prices plateaued or declined, NPLs began to climb very sharply.


The same was true for housing busts in other countries such as Spain...


and Greece...


and Ireland.


Now, is the same true for the Philippines?  Have house prices peaked?

Based on the latest available data, not yet.


Investment Overhang

In all these markets, the busts were due to an over investment in residential assets that was way, way above the historical average.

In the US, Residential Fixed Investment as a % of GDP strayed way above the historical average of 4.20% of GDP, peaking at 6.20% of GDP in 2005.


As this graph suggests, the cumulative overhang still needs to be worked off the system, as it did during the Great Depression.


The same goes true for Spain


and Ireland.
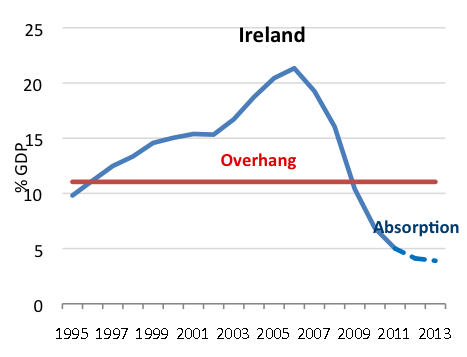


Might this be true of the Philippines as well?

Based on the available data, which covers Construction Investment and not Residential Fixed Investment, Construction as a % of GDP averaged 9.35% of GDP from 1990 to 2012.  There was a brief overhang in the years running up to the Asian Financial Crisis and an intermittent overhang from 2009 onwards.


On a cumulative basis, the current construction boom is making up for the under investment that occurred from 2000 to 2009, so the cumulative underhang stills stands at -2.40% of GDP.  At the current rate of growth, equilibrium with historical averages should occur by 2014.  As to whether the Construction Investment will continue to outpace the economy beyond that remains to be seen.


So is the bubble set to burst?  The answer is: not yet, at least on a national scale.  But on a regional scale, such as in Metro Manila, it may just be so.  But that is another story altogether.

Saturday, April 27, 2013

Is There a Real Estate Bubble in the Philippines? - June 2012

Editor's Note: This is an update of three previous blog posts: "Is There a Real Estate Bubble in the Philippines - Part II""The Philippine Banking System's True Exposure to Real Estate", and "Is There a Real Estate Bubble in the Philippines?"

Last July 25, 2012, the BSP encouraged banks, particularly Universal and Commercial Banks that continue to reflect unbooked losses or "deferred charges" arising from the 1997 Asian Financial Crisis on their balance sheets, to charge those losses against retained earnings.  This implies that the banks have a lot of "legacy assets" from a crisis that began more than 15 years ago.  Considering that the Asian Financial Crisis was primarily due to a real estate bubble, most of these so-called "legacy assets" consist of past real estate loans gone bad that are still on the books of the Philippine Banking System.

ROPOA

Our previous estimate on the true exposure of the Philippine Banking System to Real Estate (See "Is There a Real Estate Bubble in the Philippines") is inadequate because it does not include the bank's ROPOA or acquired real estate. As seen on the chart below, ROPOA as a percentage of GDP peaked at 5.18% by December 2002.  At that point in time, ROPOA comprised almost half the Philippine Banking System's total real estate exposure of 10.88% as of December 2002.  Since then, ROPOA has steadily declined as a percentage of GDP and now comprises only 1.45% of GDP as of June 2012.  However, Real Estate Loans as a percentage of GDP has been rising gradually since establishing a low of 3.75% of GDP as of March 2008.  As of June 2012, Real Estate Loans now comprise 6.79% of GDP - a level not seen since September 1999.  As a result, the Philippine Banking Industry's true exposure to Real Estate now stands at 8.24% of GDP as of June 2012.  This indicates that the Philippine Banking System's exposure to Real Estate is approaching December 2006 levels.


Distressed Assets

But ROPOA does not make the entire picture.  The banking system's true legacy assets are distressed assets which largely includes ROPOA as well as other bad bank assets.  Again, distressed assets as percentage of GDP peaked at 14.65% of GDP as of December 2001.  This ratio has steadily declined since then.  As of June 2012, distressed assets amount to only 2.49% of GDP.  When using distressed assets instead of ROPOA, the banking system's true exposure to the real estate sector peaked at an eye-popping 21.32% of GDP as of December 2000.  That number has declined to less than half the peak rate.  As of March 2012, the banking system's true exposure to the real estate sector now stands at 9.28%, slightly elevated above the low of 8.72% as of March 2008 but nowhere near its peak levels.


Tuesday, December 11, 2012

Is There a Real Estate Bubble in the Philippines - Part II

Editor's Note: This is an update of two previous blog posts: "The Philippine Banking System's True Exposure to Real Estate" and "Is There a Real Estate Bubble in the Philippines?"

Last July 25, 2012, the BSP encouraged banks, particularly Universal and Commercial Banks that continue to reflect unbooked losses or "deferred charges" arising from the 1997 Asian Financial Crisis on their balance sheets, to charge those losses against retained earnings.  This implies that the banks have a lot of "legacy assets" from a crisis that began more than 15 years ago.  Considering that the Asian Financial Crisis was primarily due to a real estate bubble, most of these so-called "legacy assets" consist of past real estate loans gone bad that are still on the books of the Philippine Banking System.

ROPOA

Our previous estimate on the true exposure of the Philippine Banking System to Real Estate (See "Is There a Real Estate Bubble in the Philippines") is inadequate because it does not include the bank's ROPOA or acquired real estate. As seen on the chart below, ROPOA as a percentage of GDP peaked at 5.18% by December 2002.  At that point in time, ROPOA comprised almost half the Philippine Banking System's total real estate exposure of 10.88% as of December 2002.  Since then, ROPOA has steadily declined as a percentage of GDP and now comprises only 1.60% of GDP as of March 2012.  However, Real Estate Loans as a percentage of GDP has been rising gradually since establishing a low of 3.75% of GDP as of March 2008.  As of March 2012, Real Estate Loans now comprise 6.44% of GDP - a level not seen since September 1999.  As a result, the Philippine Banking Industry's true exposure to Real Estate now stands at 8.55% of GDP as of March 2012.  This indicates that the Philippine Banking System's exposure to Real Estate is approaching December 2006 levels.


Distressed Assets

But ROPOA does not make the entire picture.  The banking system's true legacy assets are distressed assets which largely includes ROPOA as well as other bad bank assets.  Again, distressed assets as percentage of GDP peaked at 14.65% of GDP as of December 2001.  This ratio has steadily declined since then.  As of March 2012, distressed assets amount to only 2.81% of GDP.  When using distressed assets instead of ROPOA, the banking system's true exposure to the real estate sector peaked at an eye-popping 21.32% of GDP as of December 2000.  That number has declined to less than half the peak rate.  As of March 2012, the banking system's true exposure to the real estate sector now stands at 9.77%, slightly elevated above the low of 8.72% as of March 2008 but nowhere near its peak levels.