Search This Blog

Showing posts with label Real Estate Bubble. Show all posts

Monday, March 5, 2018

BSP's Reserve Requirement Ratio Cut Is Undeniably Very Procyclical at the Top of the Business Cycle

On February 15, 2018, the BSP said that it would lower bank's reserve requirement ratio from 20% to 19%, a move that is projected to inject at least Php 80 billion (US$ 1.53 billion) into the financial system.

This move was ostensibly done to mitigate the effects of global market volatility in the first two weeks of February 2018. But it is easy to get the impression that BSP panicked because the announcement was a surprise and was made after an unscheduled policy meeting.

This move is also undeniably pro-cyclical, coming near the top of the business cycle:

"Such an infusion of funds would risk adding to inflationary pressures in the booming economy. Some market watchers fear it is already at risk of overheating..."
It will also serve to boost asset inflation even further. Philippine interest rates are already negative as it is and have been for some time. Since 2010, anyone investing in Philippine T-Bills would have seen negative to marginal real returns after accounting for inflation. As of January 2018, the real interest rate on the 364 day T-Bill was a negative 1.12%. Increasing the money multiplier by 5.3% will only serve to lower negative real interest rates even further - at least in the short run.


 To boost real returns, investors will have to pile into physical and financial assets which are already at record high prices.

To wit, the Philippine Stock Market is already at or near record highs:


 And so is the real estate market:


 It is no coincidence that the greatest increases in asset inflation took place at a time when real interest rates were profoundly negative - as much as 2.3% during a four year period from 2011 to 2014 and in the last two years (beginning in 2016 to present).

To seek yield, investors will have to pile into even more economically marginal investments. When the business cycle turns, as it always does, expect the NPLs to pile up and put our banking system and the Philippine economy on the brink of collapse once again. A pro-cyclical macro policy taking place at the top of the business cycle will only make the bottom of the cycle that much worse. Policy makers should consider macro policies that moderate the top of the economic cycle: counter-cyclical at the top and pro-cyclical at the bottoms. In this way, the tops are less overheated and the bottoms are not as traumatic for the economy as a whole.

Monday, March 20, 2017

Have Real Estate and Construction Loans Reached a Permanently High Plateau in December 2016?

Have Real Estate and Construction Loans as a percentage of the Total Loan Portfolio (TLP) in the Philippine Banking System reached a permanently high plateau?


It would appear so.  Sometime in 2011, these loans have rocketed past their historical range of 12.6% to 16.6% of TLP and have stayed there ever since.  As of December 2016, these loans have shown no sign of coming back down to their historical ranges.  Although that ratio peaked at 20.55% as of September 2013, the ratio remains substantially elevated at 19.83% as of December 2016.

Investment in Construction as a percentage of GDP also remains elevated and, in fact, is at an all time high. This ratio logged 12.22% as of 2016, the highest it has been in twenty-six years.


Philippine Real Estate and Construction Loans Are Out of Whack As of December 2015!

Philippine Real Estate and Construction Loans Are Even More Out of Whack As of September 2015!


Has the Philippine Real Estate Bubble Already Burst?

Is There a Real Estate Bubble in the Philippines?


Are Philippine Real Estate Loans Out of Whack?

Monday, April 4, 2016

Philippine Real Estate and Construction Loans Are Out of Whack As of December 2015!

It sure looks that way, judging from this chart:


It looks like Real Estate and Construction Loans as a percentage of Total Loan Portfolio (TLP) rocketed past its historical range of 12.6% to 16.6% of TLP sometime in 2011.  That ratio peaked at 20.55% as of September 2013 but has bottomed out at 18.61% of TLP as of December 2014. In 2015, this ratio has climbed back up to 19.59% as of December 2015.


Now, are we up to the levels of the previous real estate boom? (as in mid 1990s to 1997?) Honestly, we don't know.  BSP data only goes as far back as 1999 when the previous real estate bubble had already burst and the financial system was most likely deleveraging as evidenced in this chart.


Philippine Real Estate and Construction Loans Are Even More Out of Whack As of September 2015!


Has the Philippine Real Estate Bubble Already Burst?

Is There a Real Estate Bubble in the Philippines?


Are Philippine Real Estate Loans Out of Whack?


Tuesday, January 12, 2016

Philippine Real Estate and Construction Loans Are Even More Out of Whack As of September 2015!

It sure looks that way, judging from this chart:


It looks like Real Estate and Construction Loans as a percentage of Total Loan Portfolio (TLP) rocketed past its historical range of 12.6% to 16.6% of TLP sometime in 2011.  That ratio peaked at 20.55% as of September 2013 but has bottomed out at 18.61% of TLP as of December 2014. In the last nine months of the year, this ratio has climbed back up to 19.96% as of September 2015.

Now, are we up to the levels of the previous real estate boom? (as in mid 1990s to 1997?) Honestly, we don't know.  BSP data only goes as far back as 1999 when the previous real estate bubble had already burst and the financial system was most likely deleveraging as evidenced in this chart.


Construction Gross Value as a Percentage of GDP Has Is at a 25 Year High! - Updated as of 3rd Qtr. 2015

Has the Philippine Real Estate Bubble Already Burst?

Is There a Real Estate Bubble in the Philippines?

Are Philippine Real Estate Loans Out of Whack?

Monday, October 26, 2015

Stress Has Been Building Up in the Philippine Real Estate Sector

The information presented here has been out for some time now - for at least six months.  The Philippine Real Estate Sector is already showing signs of strain - particularly in the area of in-house real estate financing wherein real estate developers finance their customer's purchases of real estate in the form of Installment Contract Receivables.

We have documented how the so-called real estate bubble has already burst for 8990 Holdings (otherwise known by its ticker HOUSE).  We have also shown how the bursting of the bubble has started to affect Vista Land & Lifescapes (VLL), 8990 Holdings' nearest competitor in the Socialized Housing space.

What is not known is how the slowdown has affected other publicly-listed Philippine Real Estate companies.

Thanks to company disclosures in www.edge.pse.com.ph, now we know.  And it doesn't look great.

We do know that, for the past three years, Past Due Real Estate Receivables as a percentage of Total Real Estate Receivables have been climbing significantly not just for HOUSE and VLL but also for inter-related companies SM Investments Corporation (SM) and SM Prime Holdings (SMPH).  In fact, SMPH holds the dubious distinction of having the highest percentage of past due real estate receivables which, at 22.16% as of 2014, dwarfs that of HOUSE and VLL.  Even Century Properties (CPG), which registered 0% past due receivables for 2012 and 2013 is showing that 1.02% of its receivables are now past due.  


As a result, impaired real estate receivables have noticeably jumped, not just for HOUSE but for Megaworld (MEG), SM, SMPH, and VLL.  If the situation continues to deteriorate in 2015, expect these numbers to climb even further this year.


So far, with the exception of HOUSE, these past due and impaired real estate receivables pose little risk to the individual companies Stockholder's Equity.


Several readers have commented that past due and/or impaired receivables pose little risk to the developer because the developer holds the title to the property until the property is fully paid for.  In the event of default, the developer can simply evict the buyer (avoiding a lengthy and expensive foreclosure process) and resell the property for even higher prices in a rising real estate market.  Thus, the financial impact of the impairment is minimized.  Yes, that may be true, especially in a hot market.  But what if there is a general slowdown and everyone wants to sell?

If the whole receivable portfolio deteriorates, some firms might be more affected than others.  Surprisingly, it's not just HOUSE and VLL but also industry stalwarts such as CPG, MEG, and ALI who bear a lot of risk.


Related Posts:


Monday, May 4, 2015

The Murky Accounting of Vista Land & Lifescapes Inc. (VLL)

Last week, we explained how the Philippine Real Estate Bubble had already burst for 8990 Holdings, Inc. (HOUSE), an up and coming mass housing developer.  A significant chunk of its Installment Contract Receivables (ICRs) are already past due (12.29% of total ICRs) as of year-end 2014.

This week, we are checking to see if the bust has proven to be systemic or has spread to one of HOUSE's main rivals in the mass housing space, namely Vista Land & Lifescapes Inc. (VLL).  VLL is not as dependent on ICRs to finance sales.  Its ICRs represent 347 days sales in 2014 vs. 661 days sales for HOUSE.  As a result, VLL is less leveraged than HOUSE in terms of ICRs.  ICRs as a percentage of Stockholders Equity amounted to only 40.93% as of 2014, less than half the level of HOUSE (94.79%) for the same period.

Like HOUSE, VLL has experienced a significant uptick in both the absolute and relative values of its Past Due But Not Impaired ICRs, particularly the ICRs that are more than 90 days past due.


Total Past Due but Unimpaired ICRs now stand at 8.83% as of 2014.

But unlike HOUSE, the relative value of its Impaired ICRs is still tiny - only 0.63% as of year-end 2014.


What is troubling is that all of VLL's ICRs are classified as Level 3, meaning that the technique used to value the asset (discounted cash flow analysis) are based on unobservable data.  In VLLs case, the particular unobservable data is the discount rate.

In Note 31 of VLL's financial statements, VLL uses the following heirarchy for determining and disclosing the fair value of its financial assets by valuation technique.  There are three levels:

Level 1: quoted (unadjusted) prices in active markets for identical assets or liabilities;

Level 2: other valuation techniques involving inputs other than quoted prices included in
Level 1 that are observable for the asset or liability, either directly or indirectly; and

Level 3: other valuation techniques involving inputs for the asset or liability that are not
based on observable market data (unobservable inputs)

The discount rate used to value VLL's ICRs ranged from 2.01% to 3.09% in 2014 and 1.33% to 3.00% in 2013.


In contrast, the carrying amounts of HOUSE's ICRs approximate fair values since the current market lending rate is equal to the interest rate of the receivables being valued.  As a result, none of the ICRs of HOUSE are classified as Level 1, Level 2, or Level 3. The ICRs of HOUSE bear an annual interest rate ranging from 8.5% to 18.0% in 2014 and 2013 and are collectible in monthly installments over a period of 1 to 25 years (Note 8: Trade and Other Receivables).

The ICRs of VLL bear an annual interest rate ranging from 16.00% to 19.00% and are collectible in equal monthly installments with various terms of up to a maximum of 15 years (Note 9: Receivables).

In Note 4 (Summary of Significant Accounting Policies) of VLL's 2014 financial statements, its receivables are:

"...recognized initially at fair value, which normally pertains to the billable amount. After initial measurement, loans and receivables are subsequently measured at cost or at amortized cost using the effective interest method, less allowance for impairment losses. Amortized cost is calculated by taking into account any discount or premium on acquisition and fees that are an integral part of the effective interest rate (EIR). The amortization, if any, is included in profit or loss. The losses arising from impairment of receivables are recognized in profit or loss."
The fair value of VLL's ICRs are valued using a discount rate which is not observable and which is significantly lower than the discount rate used on HOUSE ICRs (which is the interest rate of the receivables being valued).  "The difference between transaction price and model value is only recognized in profit or loss when the inputs become observable or when the instrument is derecognized."

Significant increases in the discount rate would undoubtedly result in significantly lower fair values of the installment contract receivables.

Two mass housing developers who operate in roughly the same space and provide in-house financing to a similar customer base have vastly different methods of arriving at the fair value of their installment contract receivables.  Both methods are acceptable under current financial reporting standards.  But one is more transparent and the other is murkier.

Which one would you trust?

Tuesday, April 28, 2015

The Philippine Real Estate Bubble Has Already Burst for HOUSE (8990 Holdings, Inc.)

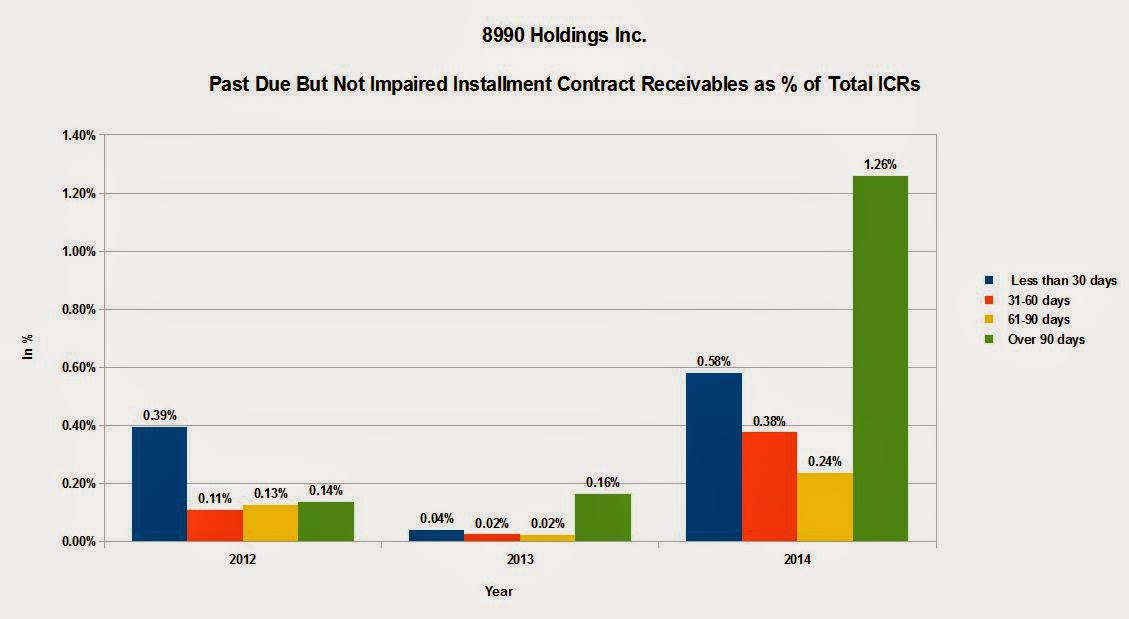
The information has been out for almost two weeks now.  It was disclosed deep in the bowels of the 2014 Annual Report of 8990 Holdings, Inc. (HOUSE).  The real estate bubble has burst ...at least for HOUSE.  There was a marked deterioration in 2014 in 8990 Holdings' Past Due but Not Impaired Installment Contract Receivables both in absolute numbers and relative to its total portfolio of Installment Contract Receivables (ICRs).  An aging analysis buried in the 2014 Annual Report showed that delinquencies jumped by a minimum factor of 10 in all aging categories, whether the unimpaired but past due ICRs were delinquent for: 1) less than 30 days; 2) 31 to 60 days; 3) 61 to 90 days; 4) over 90 days.


A few charts tell the story:


Total Past Due But Not Impaired ICRs now comprise 2.45% of 8990 Holdings Total ICR portfolio as of 2014, an exponential jump from 0.25% in 2013 and 0.77% reported in 2012.

This, by itself, is not worrying.  What is worrying is that 8990 Holdings also reported a gargantuan hockey stick type increase in its Impaired ICRs, both in absolute value and relative to total ICRs.


So now we can see that both Past Due But Not Impaired ICRs as well as Impaired ICRs collectively comprise 12.29% of 8990 Holdings Total ICR portfolio of Php 14.113 billion as of December 31, 2014.

But what does this all mean?

Under 8990 Holdings' business model, the company functions like an in-house bank or mortgage lender, providing a substantial amount of financing to its customers so that these customers in turn can buy their homes.  This model is great... when it works.  For undertaking the risk of financing its customers, the company earns interest income from its customers over and above the gross profits it earns from the sale of a property.  Under this model, the company owns the title to the properties it sells until the property is fully paid off, obviating the need for an expensive and protracted foreclosure process when a customer defaults.

Unlike a bank, 8990 Holdings has a higher cost of funds because not only does it borrow money from banks to finance the development of its properties, it also borrows money from banks to finance its loans to its customers, often by assigning its ICRs to a bank in exchange for ready cash.  A bank has a much cheaper source of funding: its depositors who these days, are paid almost nothing for keeping their money in the bank.  In order to earn a profit on its financing operations, the home financing provided by 8990 Holdings tends to be much more expensive than the home loans provided by banks. Also, the customers of 8990 Holdings tend to me much more marginal and less credit-worthy than bank customers.  After all, why would anyone go to 8990 Holdings if they can get a much cheaper loan from a bank?

Has the company been to aggressive in its focus on sales to the point of sacrificing credit quality? Perhaps.  Have home prices gone up so much past the point of affordability?  Maybe.  Have the company's customers been hit with an economic shock in the past year?  If they have, it is not obvious because the nation's GDP grew at a decent 5.30% clip in 2014. But according to the Philippines Housing Land Use Regulatory Board (HLURB), there was a 16% drop in HLURB's Licenses to Sell in 2014 in the Socialized Housing space, 8990's market niche.

With 12.29% of its customers not paying off their properties on a timely basis means that as a bank, 8990 Holdings would rank as the 19th worst bank in the country in terms of Gross NPLs/Gross Total Loan Portfolio. 

Around 80% of these past due borrowers are in severe default, hence the impaired status.  In other words, these borrowers are in the process of being evicted from their homes and their homes repossessed by the company.

The company has already made provisions of Php 130.857 million for impairment losses and has recognized a loss of Php 56.972 million on property repossessions.  Expect more to come as the "pig" of impaired ICRs" winds through the "python" of the company's eviction and repossession process.


Thursday, April 2, 2015

Construction Gross Value Added as a Percentage of GDP Has Now Surpassed Its Asian Financial Crisis Peak!

Last September 29, 2014, we noted that Construction Gross Value Added (Construction GVA) at 11.20% as of the 1st Semester of 2014 was already well above its historical average of 9.48% of GDP since 1990.  This ratio has run at an above average rate since 2009 and has already eaten away at the "cumulative underhang" or underinvestment in construction that has taken place since 2004, when the excessive investment in construction that took place in the mid to late 1990's was being absorbed.


As of year-end 2014, Construction GVA as a percentage of GDP now stands slightly higher at 11.21% of GDP.  But the real story is that Cumulative Construction GVA has gone well above equilibrium and now stands at 1.2% above equilibrium, a rise of 0.8% in just nine months.  Given all the planned new projects that are already at the execution stage, the momentum in Construction Investment will continue.


Monday, March 30, 2015

Are Philippine Real Estate Loans Out of Whack? - Updated as of December 2014

It sure looks that way, judging from this chart:


It looks like Real Estate and Construction Loans as a percentage of Total Loan Portfolio (TLP) rocketed past its historical range of 12.6% to 16.6% of TLP sometime in 2011.  That ratio peaked at 20.55% as of September 2013 but has leveled off to 18.61% of TLP as of December 2014.

Now, are we up to the levels of the previous real estate boom (as in mid 1990s to 1997)?  We don't know.  BSP data only goes as far back as 1999 when the previous real estate bubble had already burst.

Related Blog Posts:

Has the Philippine Real Estate Bubble Already Burst?

Is There a Real Estate Bubble in the Philippines?


Are Philippine Real Estate Loans Out of Whack?

Monday, October 20, 2014

The Philippine Consumer Has Not Peaked - Yet

Quite a few previous blog posts have detailed how the Philippine Real Estate Market may have already peaked in terms of sales volume and loans to the residential real estate sector.  The Philippine Real Estate Market has yet to peak in terms of price, although some of our ASEAN neighbors have already showed signs of plateauing to declining prices for residential real estate, notably including Singapore and Malaysia.

The two charts below indicate a slowdown in terms of loan growth in the real estate sector.


Since home prices have still continued their relentless climb, this  has not yet translated to a sharp uptick in Non-Performing Loans (NPLs) in the sector.


However, there was a slight uptick in NPLs from 3.15% of residential real estate loans in 2013 to 3.34% as of March 2014.


Negative Real Interest Rates

The persistence of negative real interest rates in the Philippines has led, unsurprisingly, to a sharp drop in Gross Domestic Savings Rate as a percentage of GDP since 2010.


Uptick in Consumer Loans

With negative real interest rates, it makes sense for consumers to buy tangible goods, such as real estate and cars, as a store of value.  Correspondingly, there was a sharp uptick in total consumer loans both as a percentage of GDP and as a percentage of the Total Loan Portfolio.


The uptick seems to have leveled off since 2012. Most of the increase, it seems, can be attributed to residential real estate loans and auto loans.  Again, the leveling off has not yet translated to any notable increase in consumer loan NPLs - yet.


Monday, October 13, 2014

Another Sign that the Philippine Real Estate Bubble May Have Already Peaked?

In a technical analysis of the price trends of financial securities, volume is a very important technical indicator. If the volume moves with the trend, the volume confirms the trend. When price and volume diverge, it is often indicative of a shift in the trend. For example, if an uptrending stock price is accompanied by lower and lower volumes, it may indicate that the price trend is weak and that prices may start to decline.


The same holds true for the real estate market.

US Real Estate Market

In the US, sales volumes peaked for US Total Home Sales (New and Existing Home Sales) at 8,4 million homes in 2005, a year before the US Median Sales Price peaked at US$ 225K in 2006.  By 2007, the US Median Sales Price slipped by only 1% to US$ 223K while sales volumes had already dropped an astonishing 30.58% from the peak sales volume in 2005, to 5.8 million in 2007.

From then on, the US Median Sales Prices continued to decline year after year, bottoming out at $170K in 2011, or some 25% below the peak price level.  By then sales volumes had already bottomed out a year earlier in 2010 to 4.5 million homes, or some 46% below peak volumes.


Sources: Realtor.org, St. Louis Fed

Median Sales Price is a weighted average of the median sales prices of New Home Sales and Existing Home Sales


The same dynamic played out in both segments of the US Residential Real Estate Market: New Home Sales and Existing Home Sales.

Here is the chart for New Home Sales:


And here is the chart for Existing Home Sales, the much larger market segment.


Philippine Real Estate Market

Might the same dynamic be playing out in the Philippine residential real estate market?  One problem bedevilling such an analysis is the dearth of data.

To my knowledge, the Philippines does not have adequate market data.  For instance, there seem to be no published figures for sales volumes for residential homes.  The best approximation of such data is HLURB's statistics for licenses to sell residential homes.  This statistic represents only new homes and only represents licenses to sell for each residential unit and not the actual sales volumes.

Another issue is that there seems to be no price data on residential sales.  The best data is assembled here, which in turn, is assembled from the Philippine Office of Colliers International, a global real estate agency.  These prices, in turn, are based on the average prices of a prime 3 bedroom condominium unit in the heart of the Makati Central Business District.  This is like basing nationwide US housing prices on the price of a prime 3 bedroom coop unit in Manhattan in New York, one of the priciest real estate markets in the US.  The data available in the Philippines is not representative of the true state of the entire national residential real estate market.  At best, it is an approximation of the Philippine Real Estate Market.  The BSP has stepped into the picture to overcome this deficiency by developing their own real estate index, which would be more comprehensive in scope. Here is a possible candidate for such an index.

But based on the data available, we arrived at this chart:


Based on this data, volumes (as indicated by Residential HLURB licenses to sell) may have already peaked in 2012, while prices have continued their upward climb to date.  Volume seems to have peaked at 264,237 units in 2012 and dropped 15% to 225,051 units in 2013.  In the first quarter of 2014, volumes declined further on an annualized basis, to just 189,668 units or 28% below peak volumes. 

Prices though, have continued to climb since 2012, another 14% in 2013 and another 2% in the first quarter of 2014, representing a 16% increase over 2012 prices.

Is the same dynamic that played out in the US Residential Real Estate Market playing out in the Philippines?  It looks like it, but it may still be too early to tell.

Monday, September 29, 2014

Is the Philippine Real Estate Bubble About to Burst?

In a previous blog post, we noted that Philippine House Prices have outpaced inflation by a wide margin.


Real Estate as a Store of Value:

In the Philippines, as is true in many other countries, real estate is often seen as a store of value, as a hedge against the relatively high inflation that characterizes so many emerging markets.  The investment options available and trustworthy to the general public tend to be few: government securities such as Treasury Bills, Bank Deposits, etc. As recently as 2012, less than 1% of the population own stocks because it is seen as too complex, or as investment vehicle only for the affluent, or a form of gambling. So to many Filipinos, the equity market is no place to be.

Negative Real Interest Rates

Unfortunately, the safest form of investing open to the general public, Philippine government securities, has been a money loser, inflation-wise, for the past several years.  Philippine Treasury Bill Yield Rates have continued their steady long-term decline to a point that they have barely hovered above zero in 2013.


Although yield rates have climbed in 2014, they do not compensate for the inflation underlying the economy.  As a result, real interest rates have been negative for almost four years running: from 2011 onwards.  Despite the recent rise in yields, real interest rates have dropped even further to a -2.68% as of July 2014.


The prolonged presence of negative real intest rates have increased the impetus to invest in real estate.  Construction as a percentage of GDP is the highest it has ever been since 1997 (the year the Asian Financial Crisis hit the Philippines).  Back in 1997, construction as a % of GDP was 11.14%.  As of the first semester of 2014, this ratio now stands at 11.20%, well above the historic average of 9.48%.


Construction Overhang

As a result, construction as a ratio of GDP has been well above this historic average of 9.48% since 2009.  The gains in construction spending have eaten away at the cumulative underhang or underinvestment in construction that has taken place since 2004, wherein the excessive spending that took place in the late 1990s was being absorbed.  As of now, in the first semester of 2014, the cumulative investment in construction of 0.4% is now at or slightly above equilibrium. But given the momentum of investment, construction investment is likely to surpass equilibrium in the coming years.


Real Estate Loans

The push into real estate is also reflected in Real Estate and Construction Loans.  Beginning sometime in 2010, Real Estate and Construction Loans as a % of Total Loan Portfolio broke out of its historic range of 12.5% to 17.0% from 1999 to 2010.  The percentage share of such loans peaked at 20.52% in September 2013 and has since dropped to just 18.65% as of June 2014.  Although the drop is significant, this ratio still has to drop even further to just reach the top end of its historic range.


Residential Real Estate and Commercial Real Estate Loans as a % of GDP have also begun to level off after climbing sharply since 2010.  Residential Real Estate Loans and Commercial Real Estate Loans now stand at 4.37% and 2.67% of GDP, respectively, as of March 2014.


As it stands, investment in construction and real estate have seem to reach equilibrium.  But the continued and prolonged presence of negative real interest rates will continue to drive investors to seek real estate as a store of value, a safe haven to protect their money against the vagaries of inflation.  The recent jump in Treasury Bill rates may dampen this enthusiasm for real estate but rates have to climb further for such market euphoria to disappear.

Monday, September 22, 2014

Singapore, Malaysia, and Thailand Post Flat to Declining Housing Prices, Can the Philippines and Indonesia be Not Far Behind? - 1st Qtr 2014

Almost all countries discussed in this blog post, with the exception of Thailand, have been experiencing rapid growth in home prices that have outstripped inflation by a wide margin.  The gap between home prices and their inflation adjusted levels are at the widest ever, particularly in Singapore and the Philippines. 

Singapore


Singapore's home prices slid for a second straight quarter, which, according to Bloomberg, is the longest losing streak in five years.  Home prices are still  84% above their year end 2004 levels.


Malaysia


Neighboring Malaysia's House Price Index actually topped out at 135.44% in the second quarter of 2011 and has posted a 3.37% decline since then to 130.87% as of the fourth quarter of 2013.  In the first quarter of 2014, home prices rebounded to 133.03%, reducing the decline from the peak to just 1.78%.  Home prices are just 33.03% above their year end 2004 levels.


Thailand


In Thailand, which has been experiencing political turmoil for some time, home prices have remained essentially flat since the end of 2004. Home Prices ended 2013 with the index at 100.54%, just 054% higher than the end of 2004, but showing a substantial recovery since the recent low of 74.08% posted in the third quarter of 2009. In the first quarter of 2014, home prices have rebounded to 102.13%, or 2.13% higher than its year-end 2004 levels, way below its expected inflation adjusted levels.


Indonesia


Meanwhile in Indonesia, home prices have showed no signs of slowing down their upward trajectory.  In fact, prices seem to have gone parabolic, climbing 4.63% in the last quarter of 2013, from a base of 121.49% as of the third quarter of 2013 to 127.11% as of year end 2013.  In the first quarter of 2014, home prices have climbed an additional 2.56% to reach 130.36%.  Since the first quarter of 2007, home prices have risen 30.36%. Indonesian Home Prices, like Thailand, have lagged inflation since 2007.

Philippines


Philippine house price index stands at 199.50% at the end of the first quarter 2014 or almost 100.00% above their year-end 2004 levels.  Philippine home prices have posted the largest 10 year gains among all the countries considered in this blog post.  Like Indonesia, home prices have so far no signs of slowing down their upward trajectory for the foreseeable future.   The question is, is this momentum sustainable?  Or will the Philippines and Indonesia follow its ASEAN neighbors, Singapore, Malaysia, and Thailand, in exhibiting plateauing or declining house prices?  That remains to be seen.