It sure looks that way, judging from this chart:
It looks like Real Estate and Construction Loans as a percentage of Total Loan Portfolio (TLP) rocketed past its historical range of 12.6% to 16.6% of TLP sometime in 2011. That ratio peaked at 20.55% as of September 2013 but has bottomed out at 18.61% of TLP as of December 2014. In the last nine months of the year, this ratio has climbed back up to 19.96% as of September 2015.
Now, are we up to the levels of the previous real estate boom? (as in mid 1990s to 1997?) Honestly, we don't know. BSP data only goes as far back as 1999 when the previous real estate bubble had already burst and the financial system was most likely deleveraging as evidenced in this chart.
Construction Gross Value as a Percentage of GDP Has Is at a 25 Year High! - Updated as of 3rd Qtr. 2015
Has the Philippine Real Estate Bubble Already Burst?
Is There a Real Estate Bubble in the Philippines?
Are Philippine Real Estate Loans Out of Whack?
This blog was inspired by the spectacular failure of Banco Filipino Savings and Mortgage Bank for the second time in its 38 years of existence. This blog attempts to explain Why Banco Filipino Failed. But it also attempts to assess what other Philippine Banks have the potential to fail in the not too distant future.
Search This Blog
Showing posts with label Philippines. Show all posts
Tuesday, January 12, 2016
Saturday, February 22, 2014
Has the Philippine Real Estate Bubble Already Burst?
Last May 2013, Eduardo Francisco, the President of BDO Capital and Investment Corporation - the country's largest investment house, urged the BSP to "tighten its watch over over lending activities by nonbank entities, including real-estate developers, to ensure that the country would avoid a bubble in the property market." He said that "the major banks in the country have kept their credit standards unchanged and fears that banks might be over-aggressive in lending, especially to individuals trying to secure real-estate loans, were unfounded. However, he also emphasized that non-bank entities, such as real estate developers, have also increased their real estate lending to individuals and that these activities should also be assessed by the BSP.
One such non-bank entity is the low-cost residential developer 8990 Holdings Inc (also known by its ticker "HOUSE"). HOUSE extends financing to the individual buyers of its residential units. The financing is made in the form of Installment Contract Receivables or "...receivables from the sale of residential houses and lots, condominium units and timeshares which are collectible in monthly installments over a period of 2 to 25 years. Receivables bear annual interest ranging from 8.5% to 20% for the period ended September 30, 2013 and 2012. Titles to real estate properties are transferred to the buyers upon full payment of the contract price."
Based on its unaudited financial statements as of September 30, 2013, HOUSE has Php 8.166 billion of Installment Contract Receivables, which represents more than a years worth of revenue.
| 8990 Holdings Inc. | ||
| Installment Contract Receivables/Sales | ||
| In Php | ||
| Audited | Unaudited | |
| December 31, 2012 | September 30, 2013 | |
| Installment Contract Receivables | 4,672,109,197 | 8,165,199,990 |
| Sales* | 2,888,596,423 | 4,367,429,533 |
| Days Sales | 437 | 505 |
| * Sales Figures for 2012 are for the Nine Months ended September 30, 2012 | ||
Installment Contract Receivables (ICR) of HOUSE have jumped considerably in 2013, rising 74.76% from Php 4.672 billion as of December 31, 2012 to Php 8.165 billion as of September 30, 2013. The bulk of the ICRs, around Php 7.110 billion are noncurrent, leaving Php 1.055 billion as current.
| 8990 Holdings Inc. | |||
| Installment Contract Receivables, Current and Noncurrent | |||
| In Php | |||
| Audited | Unaudited | ||
| December 31, 2012 | September 30, 2013 | % Change | |
| Current | 266,090,280 | 1,054,802,352 | 296.41% |
| Noncurrent | 4,406,018,917 | 7,110,397,638 | 61.38% |
| Total | 4,672,109,197 | 8,165,199,990 | 74.76% |
Approximately 4.65% of the ICRs as of September 30, 2013 have been classified as past due. The bulk of the increase in past due ICRs came from ICRs that were delinquent for over 90 days. The 90-day delinquency rate jumped roughly 500% in the nine months since December 31, 2012. ICRs over 90 days past due increased from only Php 39.365 million on December 31, 2012 to Php 236.008 million as of September 30, 2013. Although this is a very substantial increase in such a short span of time, the "Group did not recognize any impairment losses on its trade and other receivables for the period ended September 30, 2013 and 2012."
| 8990 Holdings Inc. | |||
| Installment Contract Receivables, Past Due but Not Impaired | |||
| In Php | |||
| Audited | Unaudited | ||
| December 31, 2012 | September 30, 2013 | % Change | |
| Less than 30 days | 76,438,532 | 102,996,723 | 34.74% |
| 31 - 60 days | 31,128,884 | 30,426,033 | -2.26% |
| 61 -90 days | 26,930,290 | 10,163,708 | -62.26% |
| Over 90 days | 39,365,086 | 236,008,574 | 499.54% |
| Total | 173,862,792 | 379,595,038 | 118.33% |
The sudden jump in very delinquent ICRs indicates that credit quality of the portfolio may not have been very good to begin with. Based on the payment terms described on HOUSE's website, it seems that buyers can basically put almost no money down to purchase a residential unit. Thus, buyers have little or no equity in their properties and can easily walk away the moment they can no longer service their debt obligations.
| 8990 Holdings Inc. | ||
| Payment Terms | ||
| Pavia Regular Unit Price | ||
| In Php | ||
| Amount | % | |
| Reservation Fee | 5,000 | 0.59% |
| CTS Gold Processing Cost: | 15,000 | 1.76% |
| Loan Value: | 830,000 | 97.65% |
| Total Package | 850,000 | 100.00% |
In environment of constantly rising housing prices, this payment scheme can entice a lot buyers to buy and "flip" a property to another buyer for a quick profit. Indeed this has been the case for a number of years:
Buyers who cannot pay the loan amortization can sell their properties into a rising market, thus keeping delinquencies to a minimum. But the moment housing prices stall or financing becomes difficult, delinquencies can accelerate at a rapid clip. This is what happened in the US subprime housing market and it could happen as well in the Philippines.
In the case of HOUSE, the company retains the title to the real estate properties until the buyer has fully paid the contract price, removing the need for the company to undergo an expensive and prolonged foreclosure process on the property.
If delinquencies continue to increase at an alarming pace, the company may have to recognize an impairment of a significant chunk of its ICRs. According to the company's guidelines on accounting estimates, it:
"reviews its receivables at each reporting date to assess whether an allowance for impairment losses should be recorded in the consolidated statement of financial position and any changes thereto in profit or loss. In particular, judgement by management is required in the estimation of the amount and timing of future cash flows when determining the level of allowance required. Such estimates are based on assumptions about number of factors. Actual results may differ, resulting in future changes to the allowance."
As it currently stands, management has determined that there should be no provision for credit losses on its ICRs. But that may change once the delinquencies are too large to ignore. And when that happens, the resulting adjustment to profits may eat into the stockholders equity of the company.
As of September 30, 2013, ICRs represent 134.98% of stockholders equity, an indication of the risk the company has undertaken to finance the sale of its real estate properties.
| 8990 Holdings Inc. | ||
| Installment Contract Receivables/Stockholders Equity | ||
| In Php | ||
| Audited | Unaudited | |
| December 31, 2012 | September 30, 2013 | |
| Installment Contract Receivables | 4,672,109,197 | 8,165,199,990 |
| Stockholders Equity | 3,948,015,021 | 6,049,131,256 |
| Installment Contract Receivables/Stockholders Equity | 118.34% | 134.98% |
This risk, by itself, is not alarming. But the company also carries another risk intrinsic to its business: a decline in real estate values.
As of September 30, 2013, the companies real estate properties had a combined value of Php 5.827 billion or 96.34% of the company's stockholder's equity.
| 8990 Holdings Inc. | ||
| Real Estate/Stockholders Equity | ||
| In Php | ||
| Audited | Unaudited | |
| December 31, 2012 | September 30, 2013 | |
| Real Estate Inventories | 2,040,532,596 | 2,081,143,259 |
| Land held for Future Development | 1,010,474,241 | 3,605,811,050 |
| Investment Properties | 142,365,067 | 140,860,631 |
| Total Real Estate | 3,193,371,904 | 5,827,814,940 |
| Stockholders Equity | 3,948,015,021 | 6,049,131,256 |
| Real Estate/Stockholders Equity | 80.89% | 96.34% |
Thus, a real estate downturn has the potential to deliver a "double whammy" to the company's bottom line:
- An Impairment of Installment Contract Receivables
- A Decline in Real Estate Values
Just a 10% across-the-board decline in both ICRs and Real Estate Values can wipe out as much as 23% of the company's capital. A 20% decline will double that to almost 50% of the company's capital, a virtual death sentence for the company.
| 8990 Holdings Inc. | ||
| ICRs & Real Estate/Stockholders Equity | ||
| In Php | ||
| Audited | Unaudited | |
| December 31, 2012 | September 30, 2013 | |
| Installment Contract Receivables | 4,672,109,197 | 8,165,199,990 |
| Real Estate | 3,193,371,904 | 5,827,814,940 |
| Total | 7,865,481,101 | 13,993,014,930 |
| 10% Losss | 786,548,110 | 1,399,301,493 |
| Stockholder's Equity | 3,948,015,021 | 6,049,131,256 |
| Impact of 10% Loss | 19.92% | 23.13% |
Nevertheless, the company remains upbeat about its prospects and has, in fact, added around Php 2.2 billion to its existing landbank. The company has hedged this expansionary bet with a follow-on offering of shares that is estimated to bring in Php 6.35 billion in cash to bolster the company's capital base. However, the company's major stockholders and officers plan to cash out on Php 4.7 billion in shares in the same follow-on offering, bringing the company's free float of shares to the 20% level.
Do they know something we don't? That remains to be seen.
Friday, May 10, 2013
If There is a Real Estate Bubble in the Philippines, How Quickly Can It Burst?
Editor's Note: This is an update of four previous blog posts:"Is There a Real Estate Bubble in the Philippines? - June 2012",
"Is There a Real Estate Bubble in the Philippines - Part II", "The Philippine Banking System's True Exposure to Real Estate", and "Is There a Real Estate Bubble in the Philippines?"
If there is a Real Estate Bubble in the Philippines, how quickly can it burst? The answer is: very quickly. Right now, NPLs (non-performing loans) are at a record low of just 2.00% of total loans, levels not seen since 1996, a year prior to the the Asian Financial Crisis. When the Asian Financial Crisis hit in the Philippines in 1997, NPLs jumped by more than two thirds, to 4.68% of total loans. The year after that, in 1998, NPLs doubled again to 10.37%. In the succeeding years, NPLs kept on climbing until it peaked at 17.35% of total loans in 2001. From then on, it took ten years for NPLs, until 2011, for NPLs to reach the pre-crisis low of 2.80% that was posted in 1996.
NPLs
Loan Growth
One factor that may have lead to the bursting of the bubble was that the growth of loans prior to the Asian Financial Crisis far outpaced the growth in the underlying economy. From 1987 to 1992, loans as a percentage of GDP climbed slowly, from a moribund 18.4% of GDP in 1987 to 24.5% of GDP in 1992. From 1992 onwards, loans as a percentage of GDP grew relentlessly each year. Just five years later, this ratio stood at 58.5% of GDP, more than double the 24.5% ratio posted five years earlier in 1992.
The sharp climb in loan growth from 1992 to 1997 indicates a significant loosening of loan underwriting standards. Loans grew at a pace faster than the economy could handle. Bankers lent and borrowers borrowed more money than they ever knew what to do with.
The question is, are we in that same situation again? The data indicates otherwise. For the past five years, loans as percentage of GDP have been stuck in the low 30s. It currently stands at 32.7% as of October 2012.
During the last US housing bubble, loan defaults remained low because borrowers who couldn't repay their mortgages simply sold the house, the underlying collateral, into an ever rising real estate market. When housing prices plateaued or declined, NPLs began to climb very sharply.
The same was true for housing busts in other countries such as Spain...
and Greece...
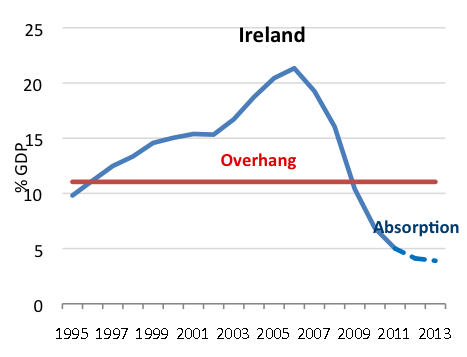
and Ireland.
Now, is the same true for the Philippines? Have house prices peaked?
Based on the latest available data, not yet.
Investment Overhang
In all these markets, the busts were due to an over investment in residential assets that was way, way above the historical average.
In the US, Residential Fixed Investment as a % of GDP strayed way above the historical average of 4.20% of GDP, peaking at 6.20% of GDP in 2005.
As this graph suggests, the cumulative overhang still needs to be worked off the system, as it did during the Great Depression.
The same goes true for Spain
and Ireland.
Might this be true of the Philippines as well?
Based on the available data, which covers Construction Investment and not Residential Fixed Investment, Construction as a % of GDP averaged 9.35% of GDP from 1990 to 2012. There was a brief overhang in the years running up to the Asian Financial Crisis and an intermittent overhang from 2009 onwards.
On a cumulative basis, the current construction boom is making up for the under investment that occurred from 2000 to 2009, so the cumulative underhang stills stands at -2.40% of GDP. At the current rate of growth, equilibrium with historical averages should occur by 2014. As to whether the Construction Investment will continue to outpace the economy beyond that remains to be seen.
So is the bubble set to burst? The answer is: not yet, at least on a national scale. But on a regional scale, such as in Metro Manila, it may just be so. But that is another story altogether.
"Is There a Real Estate Bubble in the Philippines - Part II", "The Philippine Banking System's True Exposure to Real Estate", and "Is There a Real Estate Bubble in the Philippines?"
If there is a Real Estate Bubble in the Philippines, how quickly can it burst? The answer is: very quickly. Right now, NPLs (non-performing loans) are at a record low of just 2.00% of total loans, levels not seen since 1996, a year prior to the the Asian Financial Crisis. When the Asian Financial Crisis hit in the Philippines in 1997, NPLs jumped by more than two thirds, to 4.68% of total loans. The year after that, in 1998, NPLs doubled again to 10.37%. In the succeeding years, NPLs kept on climbing until it peaked at 17.35% of total loans in 2001. From then on, it took ten years for NPLs, until 2011, for NPLs to reach the pre-crisis low of 2.80% that was posted in 1996.
NPLs
Loan Growth
One factor that may have lead to the bursting of the bubble was that the growth of loans prior to the Asian Financial Crisis far outpaced the growth in the underlying economy. From 1987 to 1992, loans as a percentage of GDP climbed slowly, from a moribund 18.4% of GDP in 1987 to 24.5% of GDP in 1992. From 1992 onwards, loans as a percentage of GDP grew relentlessly each year. Just five years later, this ratio stood at 58.5% of GDP, more than double the 24.5% ratio posted five years earlier in 1992.
The sharp climb in loan growth from 1992 to 1997 indicates a significant loosening of loan underwriting standards. Loans grew at a pace faster than the economy could handle. Bankers lent and borrowers borrowed more money than they ever knew what to do with.
The question is, are we in that same situation again? The data indicates otherwise. For the past five years, loans as percentage of GDP have been stuck in the low 30s. It currently stands at 32.7% as of October 2012.
House Prices
During the last US housing bubble, loan defaults remained low because borrowers who couldn't repay their mortgages simply sold the house, the underlying collateral, into an ever rising real estate market. When housing prices plateaued or declined, NPLs began to climb very sharply.
The same was true for housing busts in other countries such as Spain...
and Greece...
and Ireland.
Now, is the same true for the Philippines? Have house prices peaked?
Based on the latest available data, not yet.
Investment Overhang
In all these markets, the busts were due to an over investment in residential assets that was way, way above the historical average.
In the US, Residential Fixed Investment as a % of GDP strayed way above the historical average of 4.20% of GDP, peaking at 6.20% of GDP in 2005.
As this graph suggests, the cumulative overhang still needs to be worked off the system, as it did during the Great Depression.
The same goes true for Spain
and Ireland.
Might this be true of the Philippines as well?
Based on the available data, which covers Construction Investment and not Residential Fixed Investment, Construction as a % of GDP averaged 9.35% of GDP from 1990 to 2012. There was a brief overhang in the years running up to the Asian Financial Crisis and an intermittent overhang from 2009 onwards.
On a cumulative basis, the current construction boom is making up for the under investment that occurred from 2000 to 2009, so the cumulative underhang stills stands at -2.40% of GDP. At the current rate of growth, equilibrium with historical averages should occur by 2014. As to whether the Construction Investment will continue to outpace the economy beyond that remains to be seen.
So is the bubble set to burst? The answer is: not yet, at least on a national scale. But on a regional scale, such as in Metro Manila, it may just be so. But that is another story altogether.
Saturday, April 27, 2013
Is There a Real Estate Bubble in the Philippines? - June 2012
Editor's Note: This is an update of three previous blog posts: "Is There a Real Estate Bubble in the Philippines - Part II", "The Philippine Banking System's True Exposure to Real Estate", and "Is There a Real Estate Bubble in the Philippines?"
Last July 25, 2012, the BSP encouraged banks, particularly Universal and Commercial Banks that continue to reflect unbooked losses or "deferred charges" arising from the 1997 Asian Financial Crisis on their balance sheets, to charge those losses against retained earnings. This implies that the banks have a lot of "legacy assets" from a crisis that began more than 15 years ago. Considering that the Asian Financial Crisis was primarily due to a real estate bubble, most of these so-called "legacy assets" consist of past real estate loans gone bad that are still on the books of the Philippine Banking System.
ROPOA
Our previous estimate on the true exposure of the Philippine Banking System to Real Estate (See "Is There a Real Estate Bubble in the Philippines") is inadequate because it does not include the bank's ROPOA or acquired real estate. As seen on the chart below, ROPOA as a percentage of GDP peaked at 5.18% by December 2002. At that point in time, ROPOA comprised almost half the Philippine Banking System's total real estate exposure of 10.88% as of December 2002. Since then, ROPOA has steadily declined as a percentage of GDP and now comprises only 1.45% of GDP as of June 2012. However, Real Estate Loans as a percentage of GDP has been rising gradually since establishing a low of 3.75% of GDP as of March 2008. As of June 2012, Real Estate Loans now comprise 6.79% of GDP - a level not seen since September 1999. As a result, the Philippine Banking Industry's true exposure to Real Estate now stands at 8.24% of GDP as of June 2012. This indicates that the Philippine Banking System's exposure to Real Estate is approaching December 2006 levels.
Distressed Assets
But ROPOA does not make the entire picture. The banking system's true legacy assets are distressed assets which largely includes ROPOA as well as other bad bank assets. Again, distressed assets as percentage of GDP peaked at 14.65% of GDP as of December 2001. This ratio has steadily declined since then. As of June 2012, distressed assets amount to only 2.49% of GDP. When using distressed assets instead of ROPOA, the banking system's true exposure to the real estate sector peaked at an eye-popping 21.32% of GDP as of December 2000. That number has declined to less than half the peak rate. As of March 2012, the banking system's true exposure to the real estate sector now stands at 9.28%, slightly elevated above the low of 8.72% as of March 2008 but nowhere near its peak levels.
Last July 25, 2012, the BSP encouraged banks, particularly Universal and Commercial Banks that continue to reflect unbooked losses or "deferred charges" arising from the 1997 Asian Financial Crisis on their balance sheets, to charge those losses against retained earnings. This implies that the banks have a lot of "legacy assets" from a crisis that began more than 15 years ago. Considering that the Asian Financial Crisis was primarily due to a real estate bubble, most of these so-called "legacy assets" consist of past real estate loans gone bad that are still on the books of the Philippine Banking System.
ROPOA
Our previous estimate on the true exposure of the Philippine Banking System to Real Estate (See "Is There a Real Estate Bubble in the Philippines") is inadequate because it does not include the bank's ROPOA or acquired real estate. As seen on the chart below, ROPOA as a percentage of GDP peaked at 5.18% by December 2002. At that point in time, ROPOA comprised almost half the Philippine Banking System's total real estate exposure of 10.88% as of December 2002. Since then, ROPOA has steadily declined as a percentage of GDP and now comprises only 1.45% of GDP as of June 2012. However, Real Estate Loans as a percentage of GDP has been rising gradually since establishing a low of 3.75% of GDP as of March 2008. As of June 2012, Real Estate Loans now comprise 6.79% of GDP - a level not seen since September 1999. As a result, the Philippine Banking Industry's true exposure to Real Estate now stands at 8.24% of GDP as of June 2012. This indicates that the Philippine Banking System's exposure to Real Estate is approaching December 2006 levels.
Distressed Assets
But ROPOA does not make the entire picture. The banking system's true legacy assets are distressed assets which largely includes ROPOA as well as other bad bank assets. Again, distressed assets as percentage of GDP peaked at 14.65% of GDP as of December 2001. This ratio has steadily declined since then. As of June 2012, distressed assets amount to only 2.49% of GDP. When using distressed assets instead of ROPOA, the banking system's true exposure to the real estate sector peaked at an eye-popping 21.32% of GDP as of December 2000. That number has declined to less than half the peak rate. As of March 2012, the banking system's true exposure to the real estate sector now stands at 9.28%, slightly elevated above the low of 8.72% as of March 2008 but nowhere near its peak levels.
Tuesday, December 11, 2012
Is There a Real Estate Bubble in the Philippines - Part II
Editor's Note: This is an update of two previous blog posts: "The Philippine Banking System's True Exposure to Real Estate" and "Is There a Real Estate Bubble in the Philippines?"
Last July 25, 2012, the BSP encouraged banks, particularly Universal and Commercial Banks that continue to reflect unbooked losses or "deferred charges" arising from the 1997 Asian Financial Crisis on their balance sheets, to charge those losses against retained earnings. This implies that the banks have a lot of "legacy assets" from a crisis that began more than 15 years ago. Considering that the Asian Financial Crisis was primarily due to a real estate bubble, most of these so-called "legacy assets" consist of past real estate loans gone bad that are still on the books of the Philippine Banking System.
ROPOA
Our previous estimate on the true exposure of the Philippine Banking System to Real Estate (See "Is There a Real Estate Bubble in the Philippines") is inadequate because it does not include the bank's ROPOA or acquired real estate. As seen on the chart below, ROPOA as a percentage of GDP peaked at 5.18% by December 2002. At that point in time, ROPOA comprised almost half the Philippine Banking System's total real estate exposure of 10.88% as of December 2002. Since then, ROPOA has steadily declined as a percentage of GDP and now comprises only 1.60% of GDP as of March 2012. However, Real Estate Loans as a percentage of GDP has been rising gradually since establishing a low of 3.75% of GDP as of March 2008. As of March 2012, Real Estate Loans now comprise 6.44% of GDP - a level not seen since September 1999. As a result, the Philippine Banking Industry's true exposure to Real Estate now stands at 8.55% of GDP as of March 2012. This indicates that the Philippine Banking System's exposure to Real Estate is approaching December 2006 levels.
Distressed Assets
But ROPOA does not make the entire picture. The banking system's true legacy assets are distressed assets which largely includes ROPOA as well as other bad bank assets. Again, distressed assets as percentage of GDP peaked at 14.65% of GDP as of December 2001. This ratio has steadily declined since then. As of March 2012, distressed assets amount to only 2.81% of GDP. When using distressed assets instead of ROPOA, the banking system's true exposure to the real estate sector peaked at an eye-popping 21.32% of GDP as of December 2000. That number has declined to less than half the peak rate. As of March 2012, the banking system's true exposure to the real estate sector now stands at 9.77%, slightly elevated above the low of 8.72% as of March 2008 but nowhere near its peak levels.
Last July 25, 2012, the BSP encouraged banks, particularly Universal and Commercial Banks that continue to reflect unbooked losses or "deferred charges" arising from the 1997 Asian Financial Crisis on their balance sheets, to charge those losses against retained earnings. This implies that the banks have a lot of "legacy assets" from a crisis that began more than 15 years ago. Considering that the Asian Financial Crisis was primarily due to a real estate bubble, most of these so-called "legacy assets" consist of past real estate loans gone bad that are still on the books of the Philippine Banking System.
ROPOA
Our previous estimate on the true exposure of the Philippine Banking System to Real Estate (See "Is There a Real Estate Bubble in the Philippines") is inadequate because it does not include the bank's ROPOA or acquired real estate. As seen on the chart below, ROPOA as a percentage of GDP peaked at 5.18% by December 2002. At that point in time, ROPOA comprised almost half the Philippine Banking System's total real estate exposure of 10.88% as of December 2002. Since then, ROPOA has steadily declined as a percentage of GDP and now comprises only 1.60% of GDP as of March 2012. However, Real Estate Loans as a percentage of GDP has been rising gradually since establishing a low of 3.75% of GDP as of March 2008. As of March 2012, Real Estate Loans now comprise 6.44% of GDP - a level not seen since September 1999. As a result, the Philippine Banking Industry's true exposure to Real Estate now stands at 8.55% of GDP as of March 2012. This indicates that the Philippine Banking System's exposure to Real Estate is approaching December 2006 levels.
Distressed Assets
But ROPOA does not make the entire picture. The banking system's true legacy assets are distressed assets which largely includes ROPOA as well as other bad bank assets. Again, distressed assets as percentage of GDP peaked at 14.65% of GDP as of December 2001. This ratio has steadily declined since then. As of March 2012, distressed assets amount to only 2.81% of GDP. When using distressed assets instead of ROPOA, the banking system's true exposure to the real estate sector peaked at an eye-popping 21.32% of GDP as of December 2000. That number has declined to less than half the peak rate. As of March 2012, the banking system's true exposure to the real estate sector now stands at 9.77%, slightly elevated above the low of 8.72% as of March 2008 but nowhere near its peak levels.
Monday, June 25, 2012
Is There a Real Estate Bubble in the Philippines?
Editor's Note: This update reflects the true Real Estate & Construction Loans to GDP ratio published last June 25, 2012. The previous figures were published in error.
Is there a real estate bubble in the Philippines? Several people, including Finance Secretary Cesar Purisima and high profile businessman Andrew Masigan have asked this question earlier this year. Both have come to the conclusion that there is no real estate bubble - yet.
But does the data bear this out? Based on the data available from the banking system, if we are in a real estate bubble, we are only in the beginnings of one. Given the growth in our country's GDP since 1999, Real Estate Loans, on an absolute basis, have picked up noticeably since 2008, but construction loans have not.
On a relative basis, Real Estate and Construction Loans as a percentage of GDP have dropped considerably since 1999, from a high of 7.56% of GDP in June 1999 to a low of 4.43% of GDP as of March 2007. Today, that ratio has gone up considerably, and now stands at 6.46% as of September 2011. So Real Estate and Construction Loans relative to GDP have bottomed out but not have approached near peak levels of 7.56% of GDP. It is important to note that the availability of banking data available on www.bsp.gov.ph goes back only to March 1999. The previous peak levels could have been much higher.
| ||||||||||||||||||||||||||||||||||||||||||||||||||||||||||||||||||||||||||||||||||||||||||||||||||||||||||||||||||||||||||||||||||||||||||||||||||||||||||||||||||||||||||||||||||||||||||||||||||||||||||||||||||||||||||||||||||||||||||||||||||||||||||||||||||||||||||||||||||||||||||||||||||||||||||||||||||||||||||
Subscribe to:
Posts (Atom)


